 Data Exploration | |
Hi ,As some of you have noticed, a new tab has been unveiled earlier this week: Data Exploration. 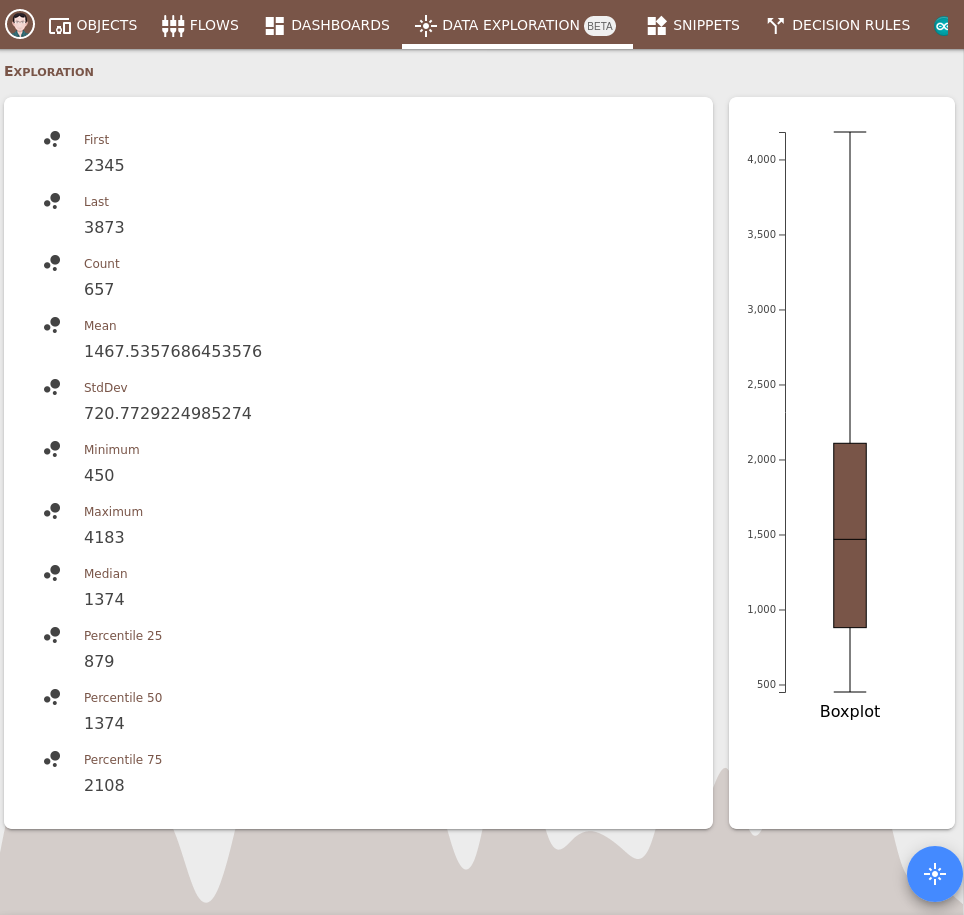 We hope this new feature will please you as it please us to implement. We hope this new feature will please you as it please us to implement.Thank you, and see you soon on t6 + Slack. – Mathieu from t6 |
Sent to by t6 from internetcollaboratif.info This is an automated system email. Please do not reply to this email. Unsubscribe from newsletters. |